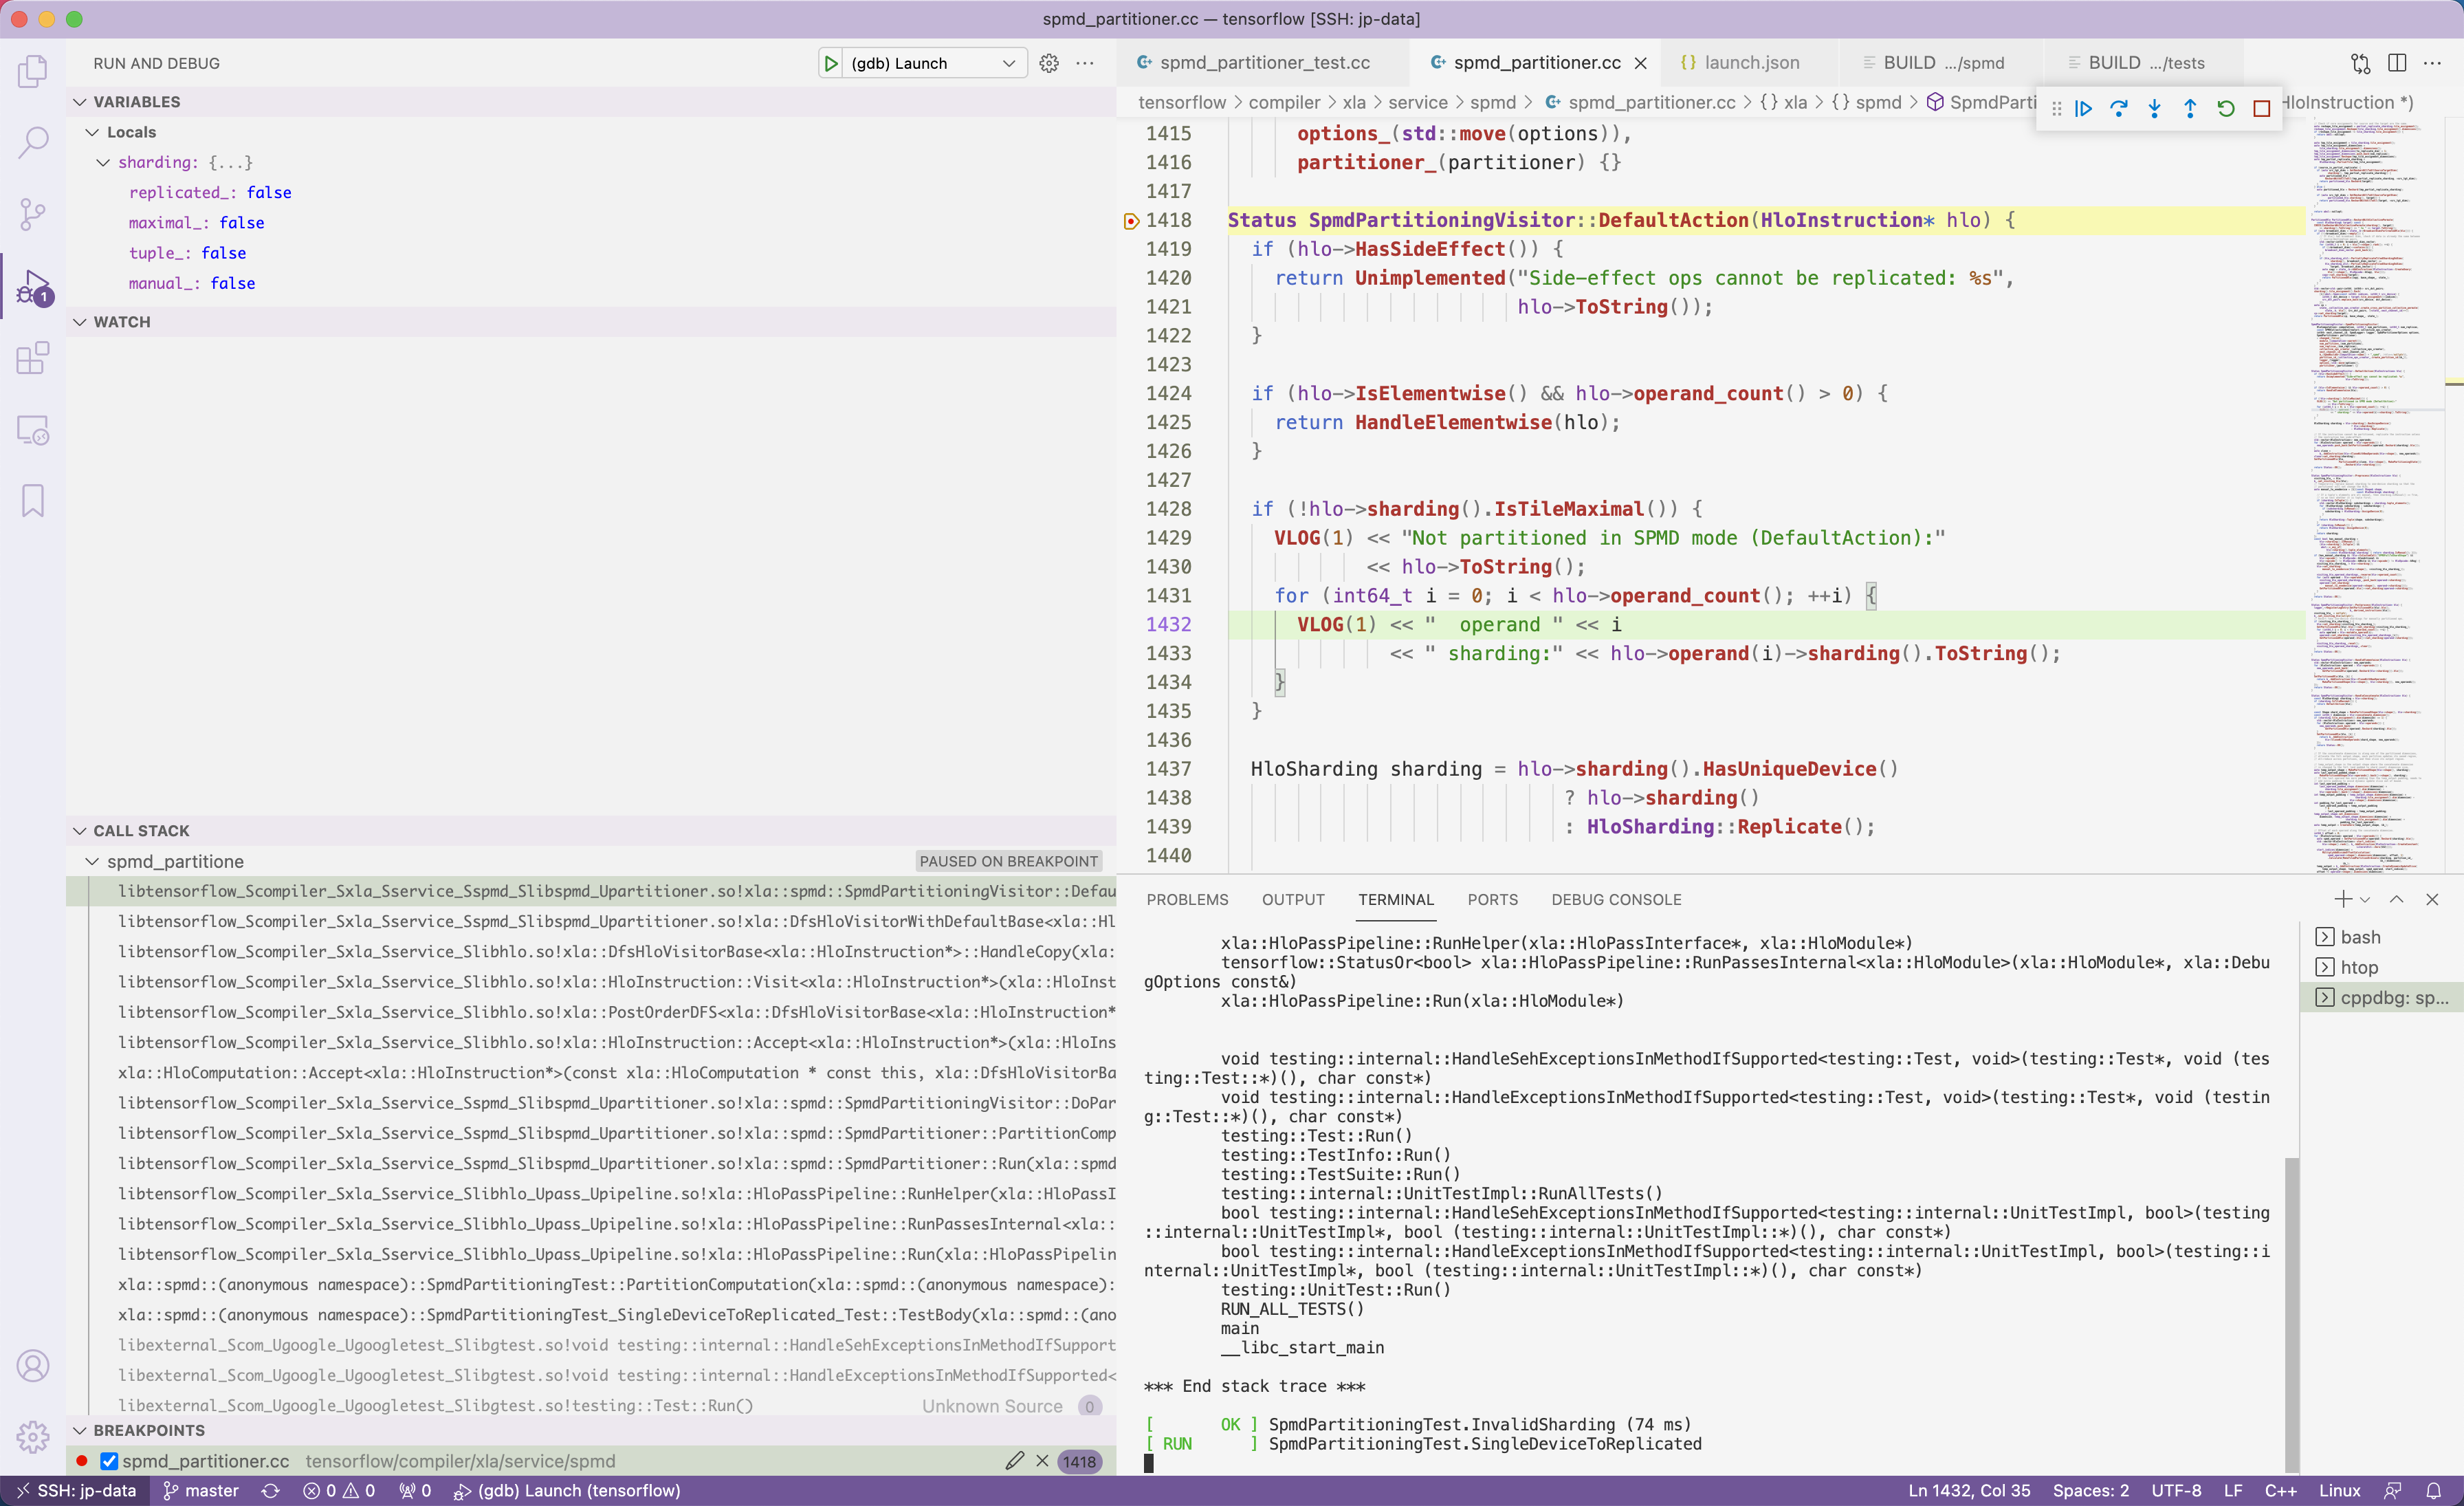
Easy way to debug TensorFlow XLA Compiler using VSCode
It would be easier to read the source code if we are aware of the runtime information, including call stacks and variable values. This tutorial introduces how to utilize our powerful VSCode to trace XLA Compiler.

Preparing Environment
Of course we need to download the source code of TensorFlow, and install all the dependencies. I suggest to use Conda to manage the environment, and use build-in GCC on Ubuntu 18.04 (or above, maybe) to build the code. Note that building from source requires about 50GiB of free space.
1 | # Fetch Source Code |
Compile the source code
First of all, configure the project and build it.
1 | ./configure |
During the configuration process, it is recommended to choose ALL the default options if it is not a must to debug on GPU, since enabling GPU support needs additional configuration (Please refer to this article) and much more time to compile.
As for the bazel build flag,
--config=dbgadds debugging symbols. Required.--config=monolithicshould generate the binary code as a single dynamic library. But this option seems to be buggy. Not recommended.
Compiling TensorFlow is quite time-consuming, and it took about 20min using 48 CPU threads on my server. Time for coffee now.
Pick a unit test to compile
In fact, we don't have to write something in Python frontend to trigger breakpoints inside XLA compiler, as there are already tons of unit tests that covers most of codes and demonstrates the capability of the compiler.
Let pick a simple test first to validate the code is compiled correctly.
1 | bazel test --config=dbg //tensorflow/compiler/xla/tests:tuple_test_cpu |
From the compiling log, we could find the executable file locates at bazel-bin/tensorflow/compiler/xla/tests/tuple_test_cpu. Execute it! If everything works well, the program will print out the message below.
1 | [----------] Global test environment tear-down |
Then pick a test you interest, and repeat the steps above.
Fix broken dependency (Optional)
Take spmd_partitioner_test as an example. This unit test can be compiled without any error message, but when you directly run the executable, you will see this message.
1 | [ RUN ] SpmdPartitioningTest.BroadcastAsReplicate3 |
This is because this executable is not linked to a valid backend, which means this executable doesn't contain the code of JIT Execution Environment. The solution is modifying the BUILD file manually to fix the dependency as the message suggests.
Open the BUILD file in the directory where the unit test locates. In this example, the test tensorflow/compiler/xla/service/spmd/spmd_partitioner_test.cc corresponds to tensorflow/compiler/xla/service/spmd/BUILD. And add this dependency //tensorflow/compiler/jit:xla_cpu_jit.
1 | tf_cc_test( |
Configuring VSCode
Since the unit test was built as an executable with debugging symbols, there is nothing special about the configuration of VSCode. Install C/C++ Extension, and write the following lines to .vscode/launch.json.
You could open that json file by clicking
ctrl/command+shift+p, typinglaunch.json, and selectingAdd Configuration->C/C++: (gdb) Launch
1 | { |
Everything is all set! Press F5 to start debugging.